Superresolution-actin-and-mitochondria-analysis
Measure mitochondrial, actin and nucleus intensity, shape and texture parameters
Description
This pipeline measures select shape, texture and intensity parameters in 3 channels; in this application for mitochondria, actin and nuclei. The mitochondrial measurement is based on the standard Mitochondrial Volume Fractionator (basic) Pipeline. Mitochondrial profiles are detected by uniform (global) thresholding in Fourier domain high pass filtered and rescaled images. The uniform threshold level-based simple segmentation used here prevents objects breaking up in contrast to the seed-based watershed segmentation used for nuclei segmentation. Based on this, mitochondrial fiber length and area is measured. Texture is measured as punctate over diffuse index (PDI) for each channel. Mean intensities are measured for each label. The valid measurement area is determined by cell segmentation using Cellpose based on the actin and nucleus channels. The pipeline calculates a single mean intensity for each frame.
- Input: a 3-channel image single plane images, or 3D z-stacks that are maximum intensity projected during opening (see setting tab in the Multi-Dimensional Open dialog). Load all images to be processed at once as an image series for faster processing.
- Output: Excel worksheet with the following 10 data columns and one row for each original image:
Ch1: Mean Plot of Mito Ch2: PDI variance Plot of Mito Ch3: Plot of Mean fiber length in Mito Ch4: Plot of Mean area in Mito Ch5: Mean Plot of Actin Ch6: PDI variance Plot of Actin Ch7: Sum Plot of Nuclei Ch8: PDI sd Plot of Nuclei Ch9: Plot of Sum area in Nuclei Ch10: Plot of Mean area in Cells
Parameters
| # | Name | Type | Description |
|---|---|---|---|
| 0 | Channel Number: Mitochondria | Integer | The first linked image window with matching channel number will be invoked. |
| 1 | Channel Number: Actin | Integer | The first linked image window with matching channel number will be invoked. |
| 2 | Channel Number: Nuclei | Integer | The first linked image window with matching channel number will be invoked. |
| 3 | Largest mitochondrion size (width in pixels) | Real | Give an approximate width of the largest mitochondria. This value controls the high pass filter to suppress larger than mitochondrial details. It does not act as a classifier for mitochondria, so slightly larger objects will also appear in the image. Decrease this value if smaller mitochondria are lost during segmentation. Increase this value if noise passes through from background. |
| 4 | Sensitivity (top range scaling, percentile) | Real | A percentile value, typically between 95-99.99 percentile. Decrease this value to increase sensitivity, if dimmer mitochondria are lost during analysis, or if bright debris is present in the image. Increase this value if noise passes through from background. |
| 5 | Minimum size (area, pixels) | Integer | Minimum size of mitochondria to detect. This is an object classifier, smaller objects than the specified size will be removed. Decrease this value if smaller mitochondria are lost during the analysis. Increase this value if noise passes through from background. |
| 6 | Python.exe in the Cellpose Environment | Text | *.exe file, without arguments |
| 7 | Cellpose: model | Text | Argument entries will be interspersed with the "Argument" entry |
| 8 | Cellpose: diamenter (pixels) | Text | Approximate diameter of cells in pixels |
| 9 | Cellpose: --mask_threshold | Text | Maximum allowed error of the flows for each mask. |
| 10 | Cellpose: --flow_threshold | Text | Minimum probability to identify cells |
| 11 | Cellpose: number of parallel processes | Integer | Image series and time courses will be split into multiple parts and separate instances of the external program is launched. |
| 12 | Cellpose: --batch_size | Text | Set batch size according to the GPU memory |
Structure
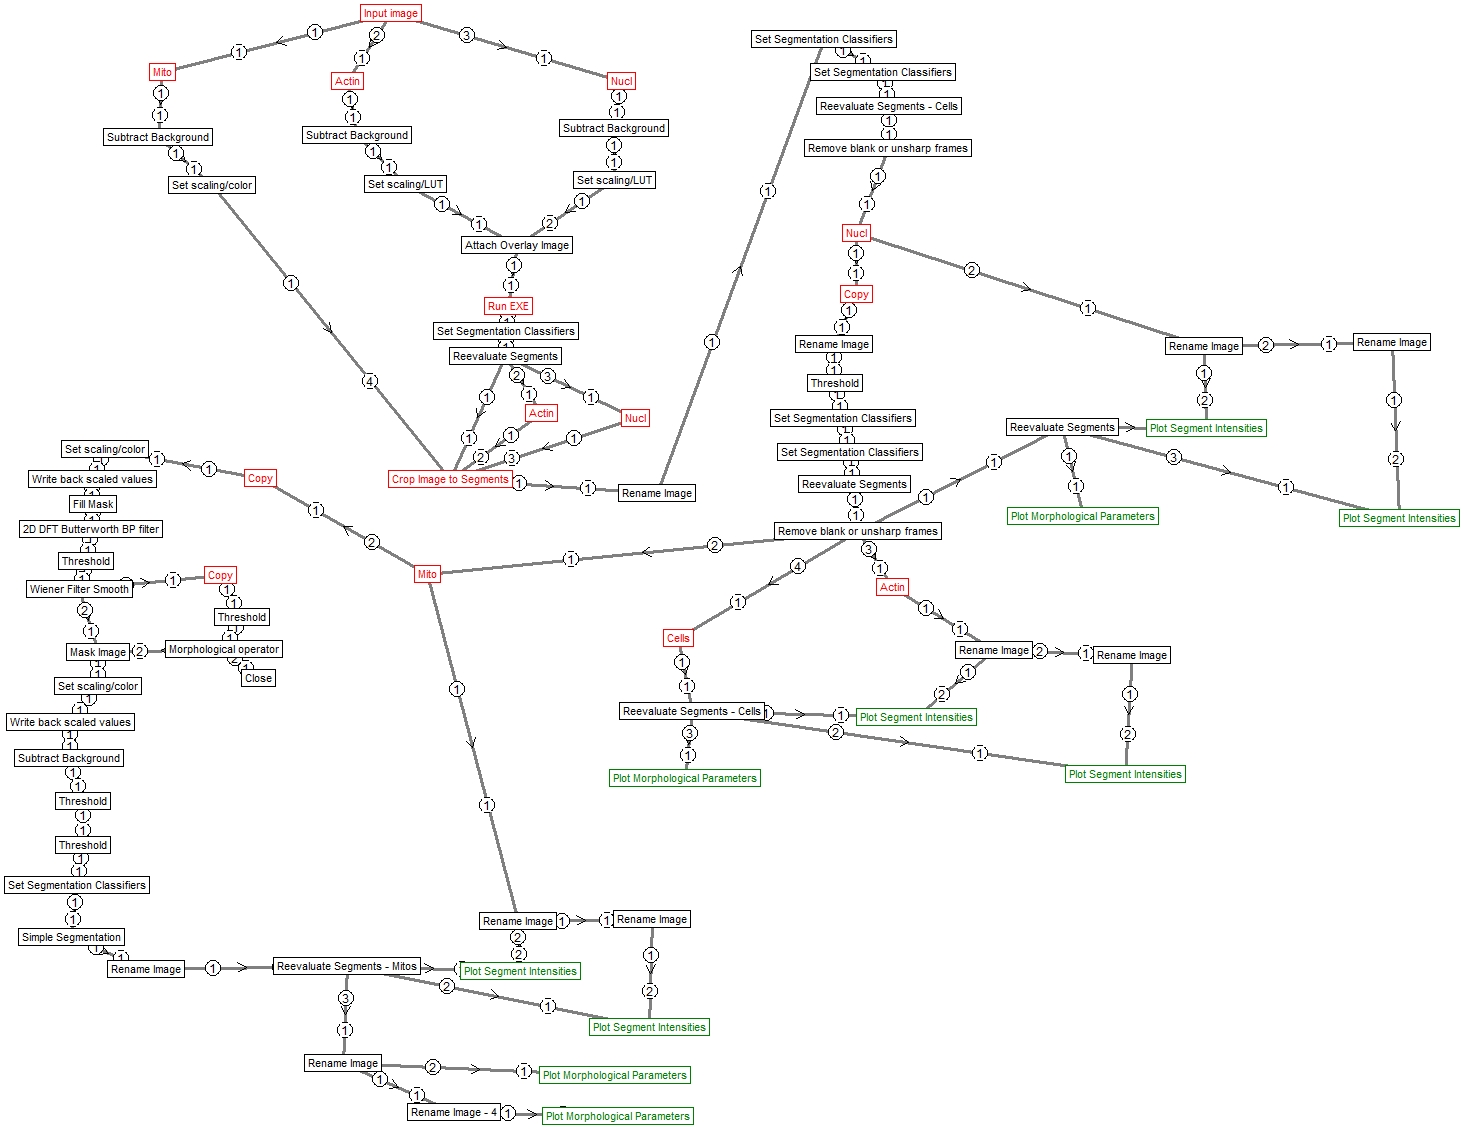
Image Analyst MKII pipeline – saved by V4.2.5 (build 838)