FAST
FAST Analysis Pipeline - Basic
Description
Fully Automated Senescence Test This is a modified version of the original "Fluorescence and absorbance histometry using nuclear marker (1-4 labels - advanced background options)" V4 pipeline. Parameters have been changed to reflect the xGAL + EdU analysis.
Assay protocol (see details on protcols.io https://dx.doi.org/10.17504/protocols.io.kxygx3ypwg8j/v1): 7.2 Determine dark current 9.1 Create fluorescence background reference image (optional) - pipeline: Create background reference image(s) for multiwell plate using median of wells 9.4 Create blank reference image for xGAL (required) - pipeline: Create BLANK reference image for multiwell plate using median 10.2 Set pipeline parameters:
- Channel numbers for nuclei segmentation, labels
- Subtract reference image background and shading correct first (all fluorescence channels): see above at #8.1
- Number of x and y tiles
- Nucleus diameter
- Perinuclear ring width (pixels) label #3
- Optical density and shading: optional dark current intensity value: as determined at #7.2 (required, or use dark current reference image)
10.3 Verify that the pipeline parameters have been adjusted properly, it is recommended to run the pipeline on individual wells for each condition to be tested (e.g. a senescent and a control well) to ensure that:
- The nuclear segmentation was performed correctly
- The perinuclear rings to measure SA-B-Gal staining do not have excessive overlap with nearby perinuclear rings.
Pipeline parameters can be iteratively modified and tested until the user is satisfied for both points above.
10.4 Run Pipeline (blue fast forward) drop-down menu, click "Run Pipeline on All Stage Positions"
Generic description of the pipeline:
Measurement of fluorescence intensities or optical densities over nuclei and perinuclear areas using a nuclear marker and 1-4 label channels. Standard morphological segmentation is used. The pipeline can run in single or tiled images and in whole wells with automatic suppression of outside of the well areas and debris (see “Suppress debris and outside of well areas”). Different measurements may be done in the same label channel, and each label can be defined as fluorescence or optical density (“Channel type”). The pipeline can also be executed on image series for faster analysis compared to frame-by-frame operation. Frames of an image series are scaled independently. For the SA-bGAL assay use "Densitometry with thin process suppression" as channel type and set the sensitivity of this at "Thin process suppression for optical density (maximal diameter in pixels)". This value is the maximal process diameter, thinner details will be suppressed. Thus a larger value provides greater suppression. This is performed by bandpass spatial filtering between the “Local background: Spatial filtering: Largest object size…” cut on and "Thin process suppression for optical density (maximal diameter in pixels)" cut off. Use additional rolling ball background subtraction. Using additional spatial filtering background subtraction will not have much further effect.
Background subtraction: The background subtraction technique can be specified for each channel. Choose percentile-based global or local background subtraction methods. All channels use the same method, and the parameters are at the end of the pipeline parameter list. For median or special filtering, the object size must be bigger than the cell size. Tiled images: the background tiling pattern or vignetting is efficiently removed by spatial filtering if the recording was performed without overlap and image registration. Provide the number of tiles in x and y direction in the “Local background: Spatial filtering: Number of tiles in x” and “…y” parameters.
Sample: fixed or live cells stained for nuclei e.g. with Hoechst 33342 or DAPI, and showing other fluorescence of interest.
Input: 2-4 channels fluorescence image showing a nuclear marker and immuno- or other fluorescence visible over the nuclei or in perinuclear areas. Low or medium magnification 10-40x. May be tiled and whole well image. The area outside of the well must be bright in the fluorescence image for auto detection of the well. Whole slide scans are also workable using the Multi-Dimensional Open/Settings/Crop multi-resolution by ROIs, analyzing multiple regions/scenes loaded as an image series.
Output: 1 morphological parameters of choice of nuclei and 4 intensity or optical density measurements in the same or different label channels. For intensity measurement the “Intensity measurement type of label #” statistics (Mean, Sum, Variance, Punctate over diffuse ratio) is calculated over nuclei or perinuclear area see (“Measure label # fluorescence over” and “Perinuclear ring width”). Output data are single cell values or histogram (see “Histogram or distribution calculation”). Note that the order of labels measured in the output worksheet may vary due to parallel processing. When “Position names and microplate worksheet output” is Yes, labels will show up in renumbered channels as: Ch0: Nuclei Morphology Ch1: Label #1 Ch2: Label #2 Ch3: Label #3 Ch4: Label #4
Reference image operation: by default, the calculation of nuclei is self-referenced. Thus, it is independently calculated for each image. This is set by the “Positive control reference image operation for nuclei detection” = ”Self-referenced” option. This works well if none of the samples have very few cells compared to others. If cell density varies between samples, or if some samples have very few cells , use positive control reference. The positive control is one of the images from the data set with about maximum number of cells and positive cells. To make reference image set “Positive control reference image operation for nuclei detection” = ”Make reference image”. Process a positive control sample. The reference images will be minimized, and reused at the following operations. Then set “Positive control reference image operation for nuclei detection” = ”Use reference image” and process all data. To process a different data set, close first reference images by “File/Close All Reference Images” and make new reference images.
Debris avoidance: to increase sensitivity, increase “Large debris removal sensitivity (%)” and decrease “Large debris minimum size (length in pixels)”. To decrease sensitivity, do the opposite. Debris avoidance may avoid cells or positive cells, if the cell count or positive cell count is too low. In this case set a small (non-zero) %, e.g. 1 as sensitivity.
Adding more processing, image filtering to labels: Open pipeline window, unlock editing and insert image processing function in between the "Add extra processing below" and "Add extra processing above" placeholders. For this pick the function to be added by pressing the F icon in the toolbar of the Pipeline window. Place this function in an empty space, and then drag it and drop it on the "Add extra processing below" label. Add more processing, or reconnect the "Add extra processing above" label by dropping it on the last added function.
Adjustments: Set approximate nucleus diameter. To this end load an image, zoom in using the magnifier glass Main Toolbar button, and then using the linear ROI button draw a line across a nucleus. Double-click the status bar of the Image Window to see the length of the ROI (Size of active ROI). The approximate nucleus diameter is used only for seeding the detection, and there are explicit minimum and maximum area gates for finer control. Run the pipeline on a single well and observe the results. In the overlay Image Window the gray fluorescence image should be well matched by the colored segments: *If single nuclei are detected as multiple segments, increase the approximate cell diameter. In addition, you may turn segment welding on. *If multiple nuclei are detected as single segments, decrease the approximate cell diameter. In addition, you may turn segment welding off. *If debris is detected a nuclei, increase background cutoff or minimum cell fluorescence. *If dimmer cells are missed, decrease background cutoff or minimum cell fluorescence. *If bright debris outshines cells, decrease debris cutoff percentile. If segmentation goes as it is desired, process the whole microplate using the double blue arrowhead button and ‘Run Pipeline … on All Stage Positions’.
Version history V1: based on “Microplate whole well cell count (automatic well positioning, with positive control)” and “Seahorse well cell count with nuclear stain”. V3: Added control on how Excel Data is recorded Debris avoidance also removes zero edges resulting from stitching Position names are shown on labels Reference image background subtraction and shading correction Optional clipping of bright foci during segmentation Accidental loopback after background subtraction in label#3 removed Explicit gating for nuclei area New "Densitometry with thin process suppression" option for channel type and "Thin process suppression for optical density (maximal diameter in pixels)" for setting its sensitivity Added "Add extra processing below" and "Add extra processing above" placeholders Added Histogram Range parameters for each label V4: ROIs are copied from original images, so ROIs may be drawn on the source images to gate the readout. Echa label can be named now. V5: Fixed error in "Use reference image" operation for nucleus segmentation
Parameters
| # | Name | Type | Description |
|---|---|---|---|
| 0 | Number of labels to measure (1-4) | Integer | Select how many label channels to measure. Each channel can be selected multiple times. |
| 1 | Histogram or distribution calculation | Text | Select Histogram to show output as histogram, or None to show individual cell values. |
| 2 | Calculate a single mean±SE for all cells | Bool | Calculates a mean value of all traces for each time point. |
| 3 | Position names and microplate worksheet output | Bool | Organizes data in table according to microplate well associations in additional worksheets. |
| 4 | Subtract reference image background and shading correct first (all fluorescence channels) | Bool | If background reference image is provided, it can be subtracted, or subtracted and also used for shading corrections. Choose between these two at the bottom. |
| 5 | Channel Number, nuclear stain | Integer | Channel number of the nuclear marker used for nucleus segmentation. |
| 6 | Background subtraction method, nuclear stain | Text | Select background subtraction method: Percentile, Rolling ball, Spatial filtering, None. See settings below. Background subtraction is performed in the same way for all channels. |
| 7 | Morphological parameter measurement for nuclei | Text | Plots and saves time course of selected morphological data |
| 8 | Histogram: range for morphological parameter measurement for nuclei | Text | If left empty or set to "All", a histogram is generated where the lowest bin starts at the smallest data point and the highest bin ends at the largest data point. If a range is given here e.g. 100-500, then the lowest bin starts at the beginning of the range and the highest bin ends at the end of the range. |
| 9 | #1: Channel Number, label #1 | Integer | Channel number of label #1 to be measured. Each channel can be selected multiple times for different measurements. |
| 10 | #1: Name for label #1 | Text | Custom name to be shown in image and plot window captions and in output data. |
| 11 | #1: Channel type, label #1 | Text | Switch between fluorescence intensity and optical density measurement. Optical density calculation needs previously set up blank reference image (cell-free image) for the given channel number. |
| 12 | #1: Measure label #1 over | Text | Intensity measurement is performed either over the nucleus or in a perinuclear ring or in the whole cell, marked by secondary segmentation of the cell area marker. |
| 13 | #1: Background subtraction method, label #1 | Text | Select background subtraction method: Percentile, Rolling ball, Spatial filtering, None. See settings below. Background subtraction is performed in the same way for all channels. |
| 14 | #1: Intensity measurement type of label #1 | Text | Available plot types: "Mean", "Sum", "Variance", "PDI variance", "PDI sd", "Line Scan". These statistics describe pixels within each segment. |
| 15 | #1: Perinuclear ring width (pixels), label #1 | Integer | Width of the ring around the nucleus to measure perinuclear area, in pixels. This is used only if "Perinuclear ring" is selected above. |
| 16 | #1: Histogram: range, label #1 | Text | If left empty or set to "All", a histogram is generated where the lowest bin starts at the smallest data point and the highest bin ends at the largest data point. If a range is given here e.g. 100-500, then the lowest bin starts at the beginning of the range and the highest bin ends at the end of the range. |
| 17 | #2: Channel Number, label #2 | Integer | Channel number of label #2 to be measured. Each channel can be selected multiple times for different measurements. |
| 18 | #2: Name for label #2 | Text | Custom name to be shown in image and plot window captions and in output data. |
| 19 | #2: Channel type, label #2 | Text | Switch between fluorescence intensity and optical density measurement. Optical density calculation needs previously set up blank reference image (cell-free image) for the given channel number. |
| 20 | #2: Measure label #2 over | Text | Intensity measurement is performed either over the nucleus or in a perinuclear ring or in the whole cell, marked by secondary segmentation of the cell area marker. |
| 21 | #2: Background subtraction method, label #2 | Text | Select background subtraction method: Percentile, Rolling ball, Spatial filtering, None. See settings below. Background subtraction is performed in the same way for all channels. |
| 22 | #2: Intensity measurement type of label #2 | Text | Available plot types: "Mean", "Sum", "Variance", "PDI variance", "PDI sd", "Line Scan". These statistics describe pixels within each segment. |
| 23 | #2: Perinuclear ring width (pixels), label #2 | Integer | Width of the ring around the nucleus to measure perinuclear area, in pixels. This is used only if "Perinuclear ring" is selected above. |
| 24 | #2: Histogram: range, label #2 | Text | If left empty or set to "All", a histogram is generated where the lowest bin starts at the smallest data point and the highest bin ends at the largest data point. If a range is given here e.g. 100-500, then the lowest bin starts at the beginning of the range and the highest bin ends at the end of the range. |
| 25 | #3: Channel Number, label #3 | Integer | Channel number of label #3 to be measured. Each channel can be selected multiple times for different measurements. |
| 26 | #3: Name for label #3 | Text | Custom name to be shown in image and plot window captions and in output data. |
| 27 | #3: Channel type, label #3 | Text | Switch between fluorescence intensity and optical density measurement. Optical density calculation needs previously set up blank reference image (cell-free image) for the given channel number. |
| 28 | #3: Measure label #3 over | Text | Intensity measurement is performed either over the nucleus or in a perinuclear ring or in the whole cell, marked by secondary segmentation of the cell area marker. |
| 29 | #3: Background subtraction method, label #3 | Text | Select background subtraction method: Percentile, Rolling ball, Spatial filtering, None. See settings below. Background subtraction is performed in the same way for all channels. |
| 30 | #3: Intensity measurement type of label #3 | Text | Available plot types: "Mean", "Sum", "Variance", "PDI variance", "PDI sd", "Line Scan". These statistics describe pixels within each segment. |
| 31 | #3: Perinuclear ring width (pixels), label #3 | Integer | Width of the ring around the nucleus to measure perinuclear area, in pixels. This is used only if "Perinuclear ring" is selected above. |
| 32 | #3: Histogram: range, label #3 | Text | If left empty or set to "All", a histogram is generated where the lowest bin starts at the smallest data point and the highest bin ends at the largest data point. If a range is given here e.g. 100-500, then the lowest bin starts at the beginning of the range and the highest bin ends at the end of the range. |
| 33 | #4: Channel Number, label #4 | Integer | Channel number of label #4 to be measured. Each channel can be selected multiple times for different measurements. |
| 34 | #4: Name for label #4 | Text | Custom name to be shown in image and plot window captions and in output data. |
| 35 | #4: Channel type, label #4 | Text | Switch between fluorescence intensity and optical density measurement. Optical density calculation needs previously set up blank reference image (cell-free image) for the given channel number. |
| 36 | #4: Measure label #4 over | Text | Intensity measurement is performed either over the nucleus or in a perinuclear ring or in the whole cell, marked by secondary segmentation of the cell area marker. |
| 37 | #4: Background subtraction method, label #4 | Text | Select background subtraction method: Percentile, Rolling ball, Spatial filtering, None. See settings below. Background subtraction is performed in the same way for all channels. |
| 38 | #4: Intensity measurement type of label #4 | Text | Available plot types: "Mean", "Sum", "Variance", "PDI variance", "PDI sd", "Line Scan". These statistics describe pixels within each segment. |
| 39 | #4: Perinuclear ring width (pixels), label #4 | Integer | Width of the ring around the nucleus to measure perinuclear area, in pixels. This is used only if "Perinuclear ring" is selected above. |
| 40 | #4: Histogram: range, label #4 | Text | If left empty or set to "All", a histogram is generated where the lowest bin starts at the smallest data point and the highest bin ends at the largest data point. If a range is given here e.g. 100-500, then the lowest bin starts at the beginning of the range and the highest bin ends at the end of the range. |
| 41 | Histogram: number of bins | Integer | When the output is histogram, the histogram is calculated using this number of equal sized bins, where the lowest bin starts at the smallest data point and the highest bin ends at the largest data point. If explicit range definition is used below, the bins will bound the given range. Use zero bin size for automatic binning. |
| 42 | Positive control reference image operation for nuclei detection | Text | The positive control is an image with many visible cells. Using a positive control avoids amplifying background noise in wells with little or no cells. |
| 43 | Suppress debris and outside of well areas | Bool | Brighter areas corresponding to the bottom of microplate outside the well area will be masked. |
| 44 | Debris masking: minimum diameter of continuous bright spot | Real | Bright objects larger than this pixel value will be masked, and these areas not used for cell detection and measurements. |
| 45 | Debris and well edge detection sensitivity (%) | Real | Percent of Otsu optimal threshold value. Lower is more sensitive. |
| 46 | Nuclei: Diameter (pixels, for seeding) | Integer | Diameter of the nucleus in pixels. Nuclei ranging around this size will be selected. |
| 47 | Nuclei: Minimum area (pixels, for gating) | Integer | Pixel area gate for detected nuclei, set 0 to disable. |
| 48 | Nuclei: Maximum area (pixels, for gating) | Integer | Pixel area gate for detected nuclei, set 0 to disable. |
| 49 | Nuclei: Debris cutoff for nuclear stain (percentile) | Real | This percentile of the image histogram sets the intensity value where the maximum of the Look Up Table (LUT) is scaled. |
| 50 | Nuclei: Clip bright nucleoli | Bool | Set Yes if only part nuclei are detected due to the presence of bright spots within nuclei. |
| 51 | Nuclei: Minimum fluorescence (%) | Real | Nuclei must be brighter than this percent of the maximal scaling value, set by the "Debris cutoff" percentile value. Increase this value if debris dimmer than the cells is detected. |
| 52 | Nuclei: Shape factor (minimum; 0-1) | Real | 1 for disc, smaller for irregular shapes. 0 for not checking |
| 53 | Nuclei: Weld segments into round objects | Bool | Weld touching segments if they form a rounder object together. Use this to avoid objects fragmenting into multiple segments. |
| 54 | Nuclei: Discard segments at edges of the image | Bool | Any segment that has at least 10% of its boundary at the edge of the image will be discarded. |
| 55 | Background percentile | Real | If background subtraction method is percentile, this percentile value will be used in all channels. |
| 56 | Local background: Rolling ball: median filter size | Integer | Set this value larger than the object of interest in pixels, if using this type of background subtraction. |
| 57 | Local background: Spatial filtering: Number of tiles in x | Integer | The image consists of this number of equal sized tiles in x dimension. Required if background subtraction is spatial filtering. |
| 58 | Local background: Spatial filtering: Number of tiles in y | Integer | The image consists of this number of equal sized tiles in y dimension. Required if background subtraction is spatial filtering. |
| 59 | Local background: Spatial filtering: Largest object size (for background removal, pixels times number of tiles) | Real | Objects larger than this will be removed as background by spatial filtering. The typical object pixel size must be multiplied by the number if tiles (in x or y). Cut on of the band pass Butterworth filter. . |
| 60 | Thin process suppression for optical density (maximal diameter in pixels) | Real | For "Densitometry with thin process suppression" this value is the maximal process diameter, thinner details will be suppressed using spatial filtering. |
| 61 | Optical density and shading: optional dark current intensity value | Real | Enter average pixel intensity measured in an unilluminated, dark image, if not using a dark current reference image when calculating optical density. |
| 62 | Reference image background: Select "Reference Image" or "Background and shading correction by Background Reference Image" | Text | What kind of background to subtract. Calculated for each frame or for the whole image series. |
Structure
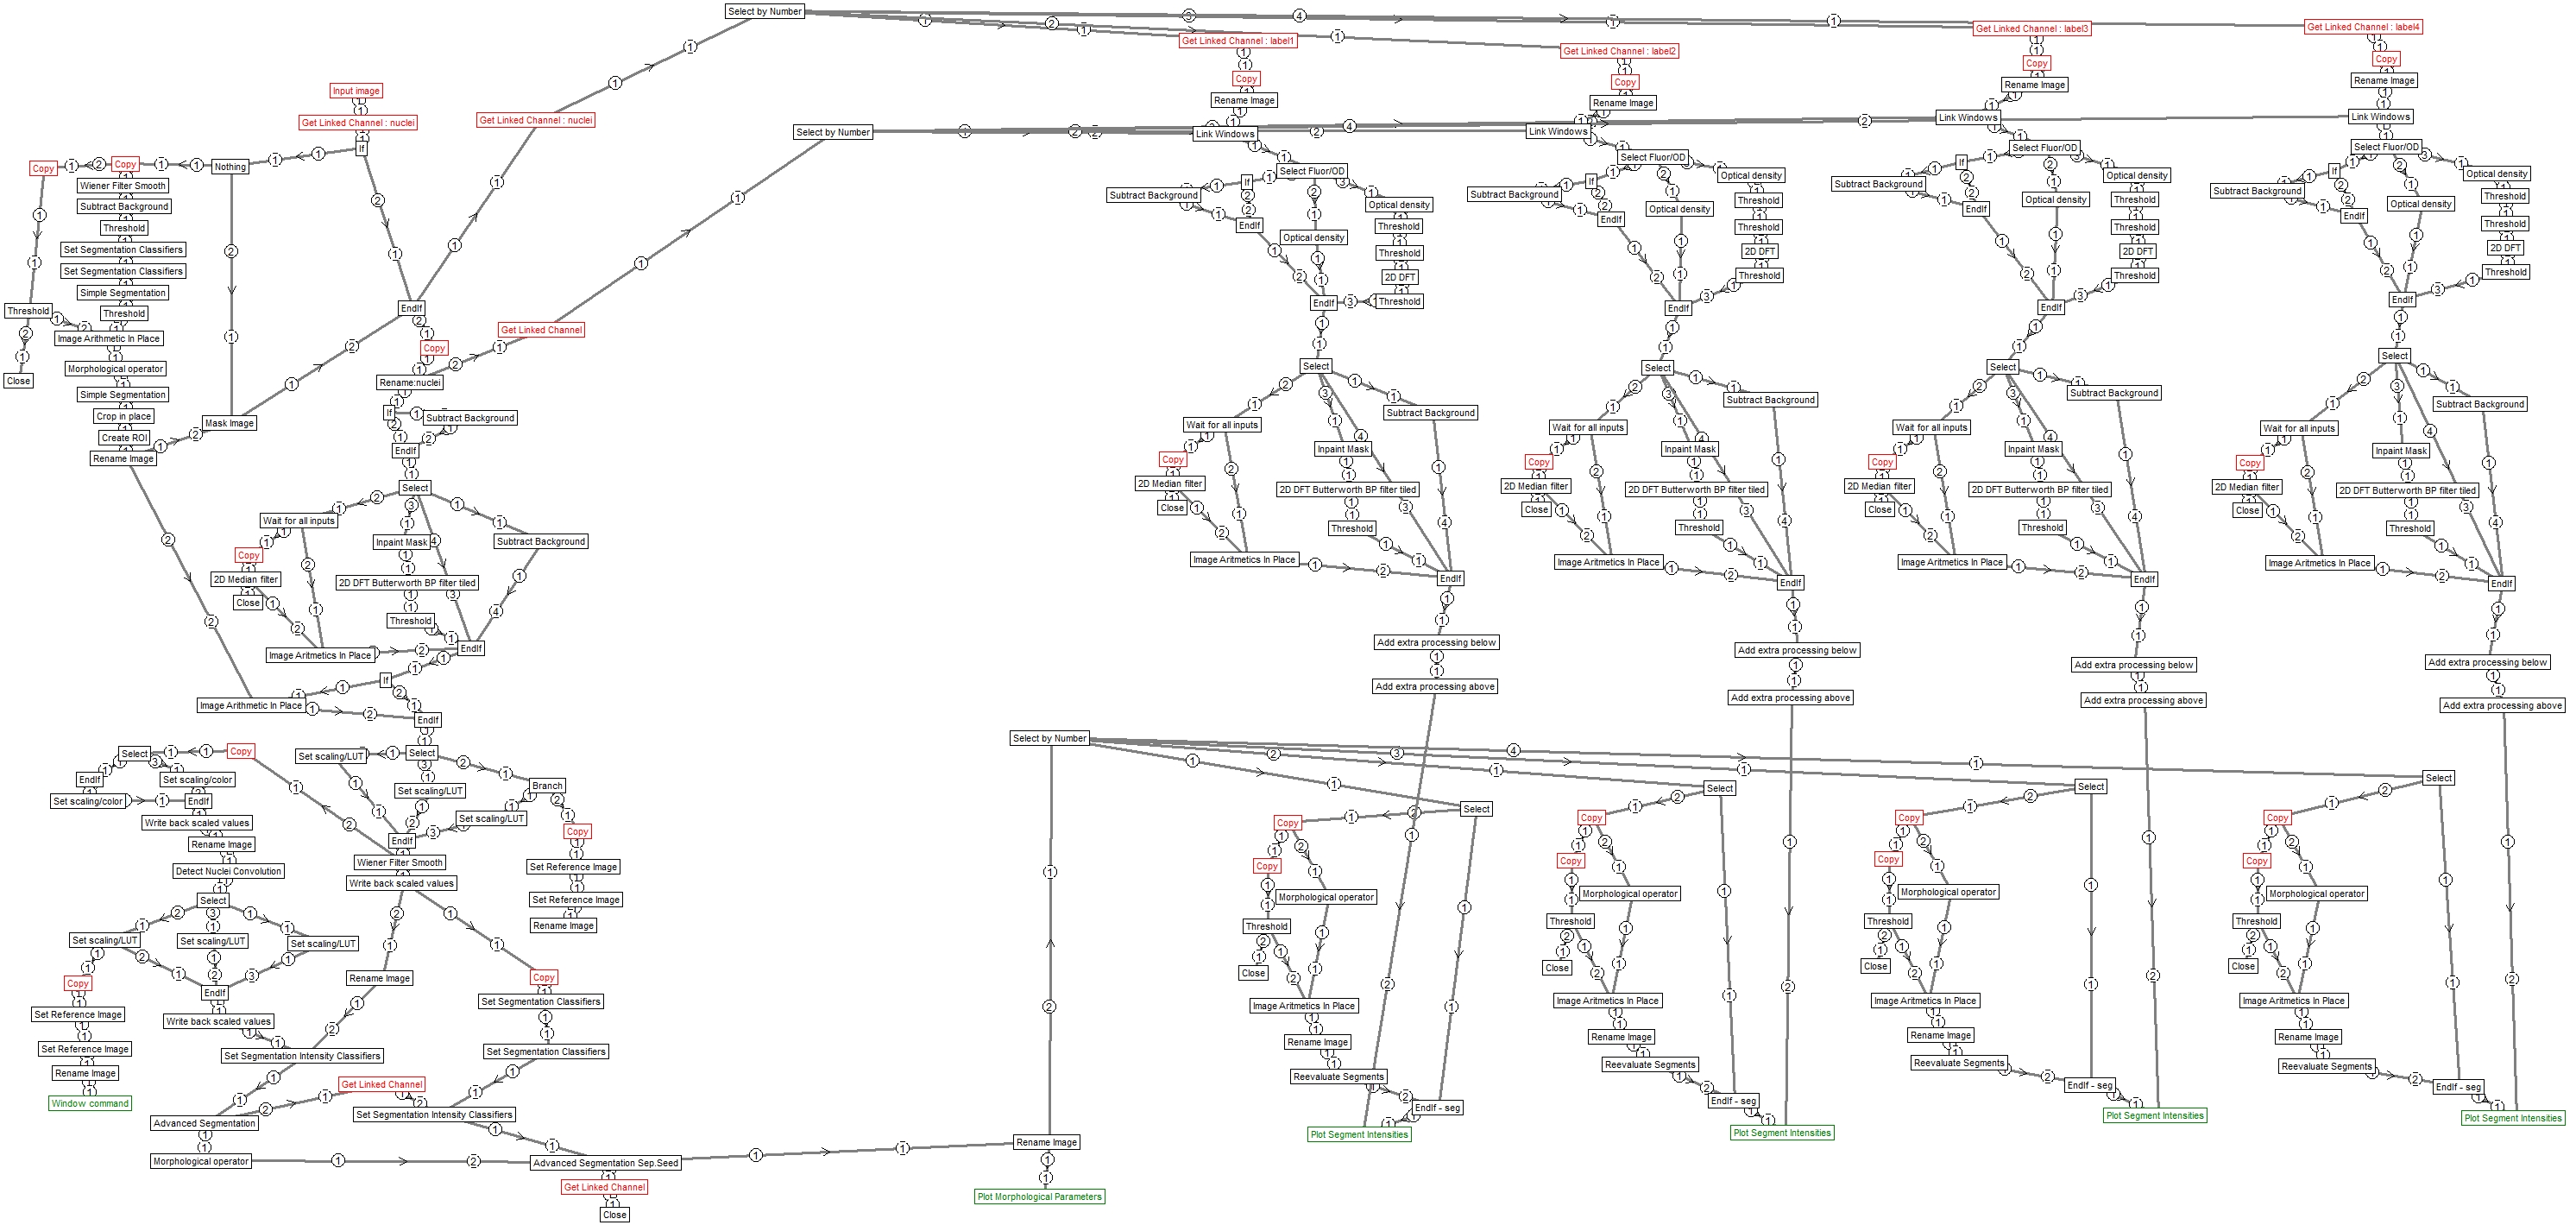
Image Analyst MKII pipeline - saved by V4.2.14 (build 976)